This post was originally published as an ebook back in 2014. As the information sstarted to lose momentum and fresher SEO CTR benchmark values have been published, we decided to publish the analysis report here, for free.
If you find any value at all in us making it as a standalone article – please let us know by either dropping a quick comment or giving this post a share. Thank you.
The question of how organic clickthrough rate is evolving with Google’s continuously improving search results came up almost a decade ago and is still left unanswered.
Ten years ago, when only 10 blue links were shown, we would mostly rely on the "F" reading pattern to explain the users’ preference for the first listings in search results. Nowadays Google is mixing the SERPs with dozens of distracting elements like images, video, news, carousels, entities and so on. That is one of the reasons why, in 2014, it is close to impossible to predict what will catch the reader’s eye on a search results page.
In this study we’ve looked at how different types of search results influence users’ behaviour and what role does user intent play in determining the distribution of clicks.
The study is based on data collected from Google Webmaster Tools for the month of July, 2014. We have analyzed a total of 465.000 keywords across 5.000 websites.
The Evolution of Google Search Results
Back in 1998, Google began with a very simplistic approach to the search results: ten blue links.
Since most of us read from left to right and from top to bottom, is it easy to realize that this minimalistic layout resulted in a very high CTR for the first organic search results.
Somewhere in the second part of the year 2000, the first ads appeared. At that time ads were placed on the right side of the organic search results and they were clearly marked with a yellow background.
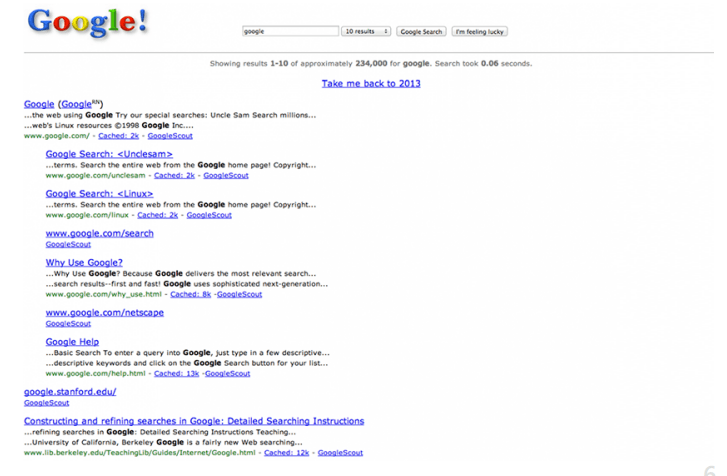
Later, Google realized that their users needed to search through more than just websites. Therefore, in 2001 the Image search has been introduced, and with it, the revolution of the SERPs has started.
Then, in 2007, Google introduced Universal Search, which included all the new data that Google has been crawling for the previous 5 years: news, videos, books, products, stock quotes, blogs, weather, flights, sport scores and patents.
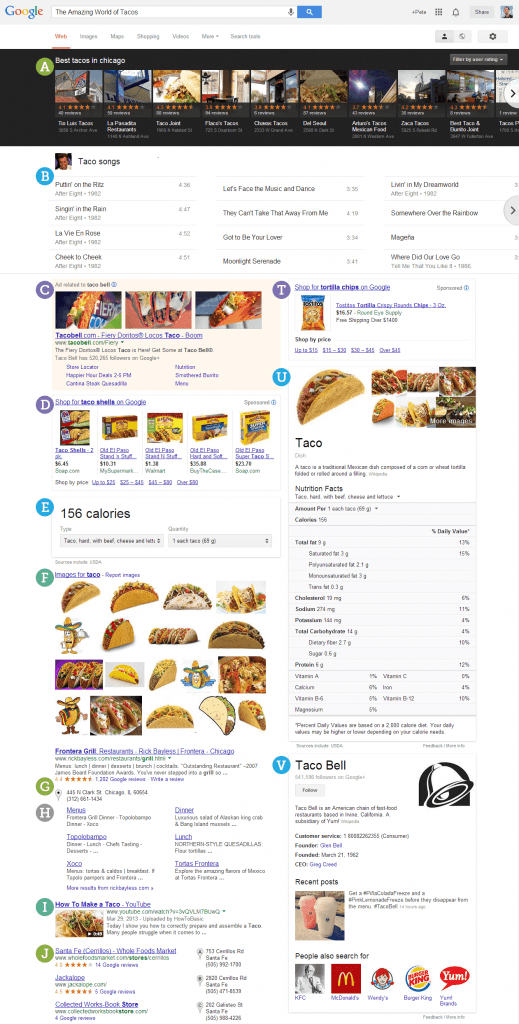
But with all this information blended into the list of results, Google had to find a way to predict the type of content that the searcher might be seeking and figure out a way to show all this information in a relevant way.
Nowadays, Google even strives to provide the answers directly into the SERPs, rather than listing the sites that may answer our questions.
Since millions of sites depend upon Google for attracting potential customers, the potential impact of these changes to online business, as a whole, is huge.
What Influences CTR?
Organic click through rate is one of the best metrics to measure online businesses’ performance in SERPs and to illustrate the users’ search behaviour.
In addition to the well-known tweaks marketers make to influence organic CTR (titles, meta descriptions, snippets, calls to action etc.), today there are several other elements, out-of-a-marketer’s-control, that alter organic CTR.
In this study, we wanted to focus on some of these factors and their impact on organic CTR to provide marketers with actual data to base their predictions on.
2.1. The everchanging Google results
Other than the constant shifts in Google’s UI, search results are dramatically changing in complex ways. Because nowadays users are no longer using “keywords” for search, but they are entering complex queries and questions, Google too had to evolve, up to the point where it actually tries to come up with answers rather than just results.
Trying to meet the users’ intent based queries, Google now serves richer, more relevant answers:
Knowledge graph “instant results” for people, places and things.
Product listings / shopping for buying signals.
Dictionary results for “definition-based” queries
However, the downside is that, as a result, lots of these queries no longer need to result in a click. One of our goals in this study was to find out the current amplitude of such abandoned searches.
2.2. Ads
We know that with each search query, a decent share of clicks is accounted to the sponsored results, but not all ads are created equal.
With more than a decade since the launch of Google AdWords, paid listings have also evolved, being now displayed at the top, bottom or right side of organic listings.
Does the appearance of each type of paid listings influence the users’ organic click behaviour? This is also something that we wanted to find out with this study.
2.3. User intent
Since at the heart of every google search is a need, the content earning the click in search results is the one who succeeds in meeting that particular need.
Meaning that the user’s preference for one search listing or another greatly depends on the search intent:
Navigational queries (where you need to go)
The intent here is to reach a particular site.
Navigational queries amount to around 10% of web queries, the reason for this type of queries being that it might be more convenient to use the search bar than typing the URL or when the user simply doesn’t know the website he is looking for.
For this kind of searches the “right” answer is usually unique and listed among the first few search results.
Informational queries (what you need to know)
The intent here is to acquire information assumed to be present on one or more web pages.
This type of queries constitute the majority of web searches (80%), typically articles, forums, blogs and topic-specific directories being sought by information seekers.
Transactional queries (what you need to do)
The intent here is to perform a web-mediated activity.
Online shopping, forms, registrations, downloads or any time a user needs to interact with a page, constitute transactional search queries (around 10% of web queries).
But how willing are users to seek for the right website among all search results depending on their search intent? Or how elaborated is the enunciation of their search query for a particular intent? And how does this reflect on the relevancy of the results retrieved, and eventually on organic CTR?
These are all questions we are trying to find the answer to with this study.
2.4. User device
The particularities of users’ behaviour on mobile devices are inevitably being cast forth, influencing the users’ mobile search habits as well. We suspected that this would translate into a different organic CTR pattern across the mobile search results pages.
The hypothesis was sustained by a number of previously researched figures:
According to Google, users regularly search on mobile during the buying process - 74% searched on mobile using a search engine, while 48% started the research on search engines.
A sense of urgency is also defining for the mobile buying intent - 55% of consumers using mobile for research want to purchase within an hour, 83% want to purchase within a day.
Smartphone users typically use their device when they are on the go (68% according to the xAdtelemetrics Mobile Path to Purchase Study), the car being the most popular on the go location for mobile searches.
Location proximity also matters to mobile searchers - 69% of users expect business to be within 5 miles or less of their location.
We also wanted to see the impact that the mobile search user interface has on organic CTR, with significantly fewer search items displayed above the fold on mobile devices.
Previous CTR Studies
The first real chance that search marketers had to examine click-through rates on organic search results came after AOL released 20 million search queries made by more than a half-million users in 2006.
A number of studies followed after that, including those from Enquiro (now Mediative) in 2007 and later by Chitika and Optify in 2010. More recent studies have been performed by Slingshot and Catalyst in 2011 and 2013 respectively.
Here is a comparison of the Click Through Rate for each study:
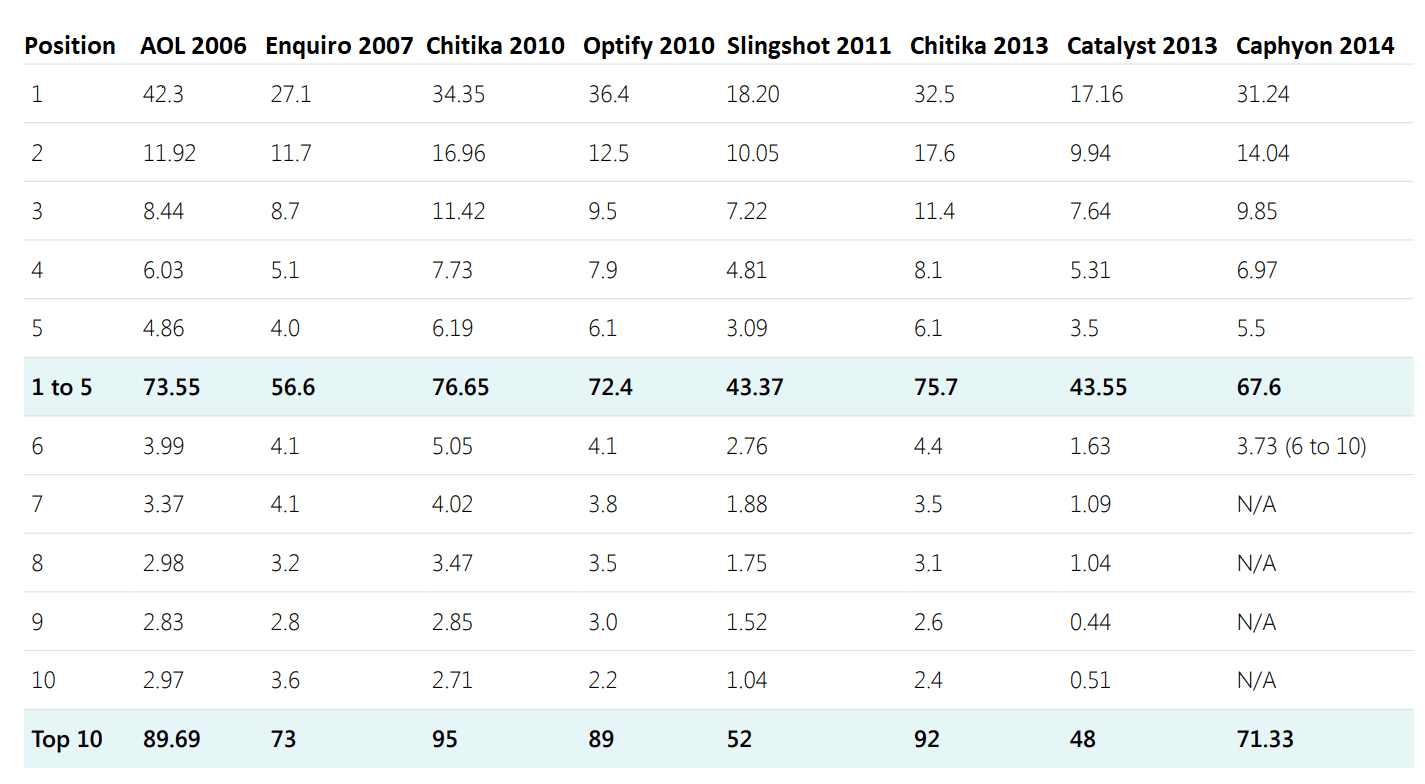
It’s important to emphasize the major differences in the methodologies applied for each study, as they are the main ingredients responsible for the dissimilarity of the results:
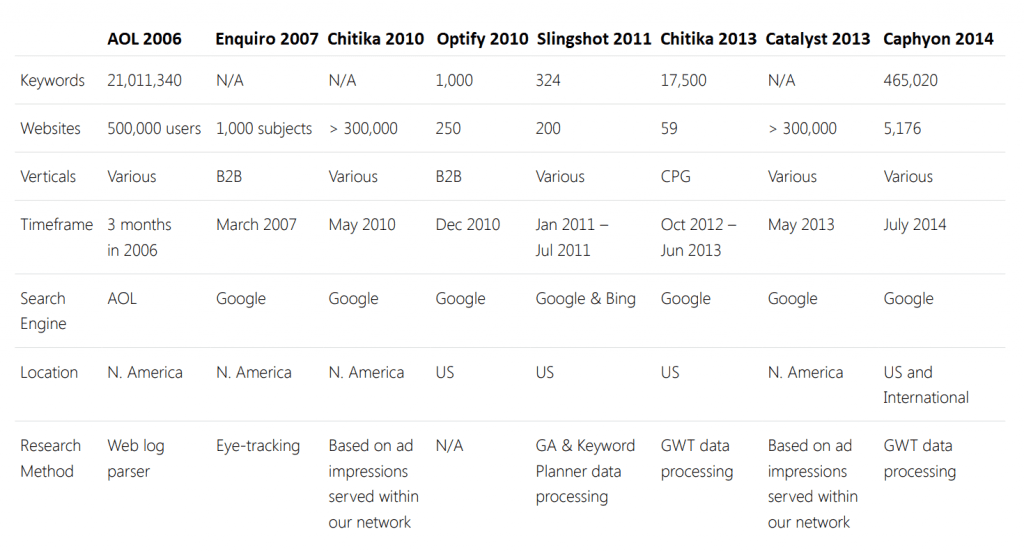
It’s worth noting that the studies conducted by Mediative (former Enquiro) and Chitika, have been executed through unique methods that cannot be truly compared to any of the other studies. Mediative’s study relies on survey data and eye-tracking research, while Chitika’s studies are based on ad impressions served within their network.
Also relevant for a comparison is how CTR is defined for the other three studies previously conducted:
Optify defines CTR as “the percentage of users that clicked on each position, given that a user clicks on a top 20 organic ranking”. Their study makes the assumption that all searches result in a top 20 organic click.
In the Slingshot SEO study, CTR is calculated as “total visits (via Google Analytics) divided by total searches (via Google AdWords Keyword Tool) for a given keyword over a stable period”.
For the Catalyst study, CTR is defined as “the percentage of impressions that resulted in a click for a website (via Google Webmaster Tools)”.
The current study retrieves the CTR data from Google Webmaster Tools so comparing it with the Catalyst study would be the most accurate.
Our Methodology
Here’s how we obtained this data in case you want to do the same analysis for your own websites:
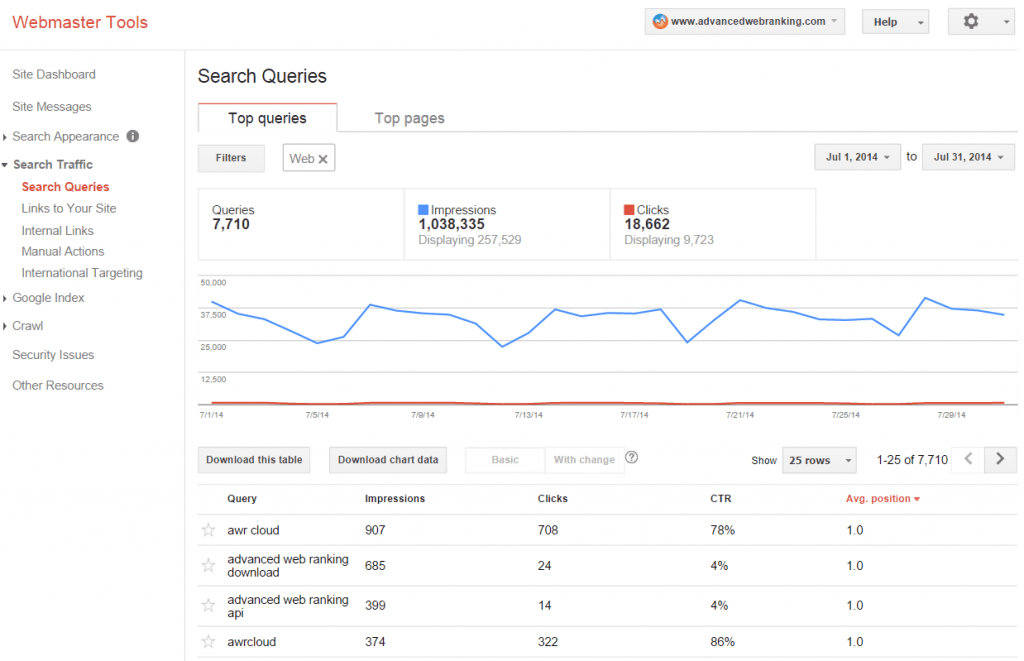
4.1. Download average search query data from GWT
The initial data was obtained from GWT with the default filter: Web. This includes only traffic coming from non mobile devices. Our average data set includes only keywords that have at least 50 impressions per month.
We then changed this filter to Mobile filter and downloaded the table again to get mobile data.
The Avg. position column displays an average of all ranking positions that this keyword has appeared in. This data was used to build the average charts.
4.2. Download exact search query data from GWT
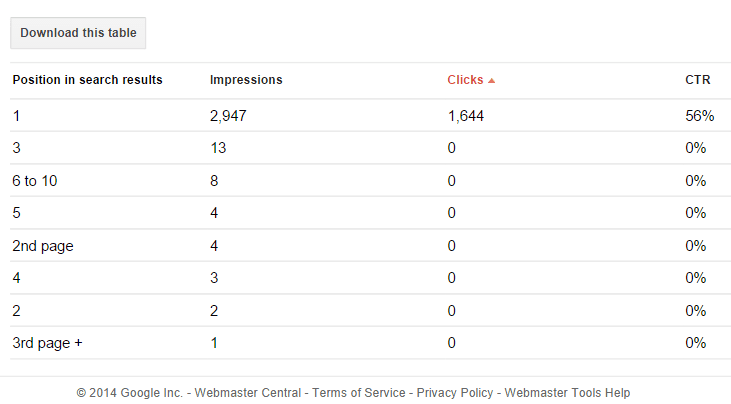
When you click on a keyword in the Search Queries table, you will go to a report called Query Details. This report provides the CTR for each exact ranking position.
For example we can see here that for all searches when this keyword was ranked first, the CTR was 56%. That’s because 2,947 people searched for it (Impressions) but only 1,644 people actually clicked on it (Clicks).
4.3. Exclude from exact data the queries with less than 500 impressions per month
This was done to ensure that we get accurate results for CTR. We also included only those keywords that had at least 10 impressions for each position they appeared in.
4.4. Categorise queries based on brand, search intent and number of words
We wanted to see how the CTR changes for people looking for branded keywords. Most brands rank first for their brand keywords and it is believed that people tend to click on that first result.
For this study we have defined brand searches as searches that contain the entire domain name of the website in the query, with all the spaces and dashes removed.
The same thing happens when people include a search intent in their query. It is believed that people act differently when they are interested to buy something as opposed to looking for something or comparing different things.
How can we figure this out? We look for certain words in the search queries, trying to guess what the intent was for that search.
There are three types of search intents included in this study:
Informational
This includes searches that contain words like: what, when, where, how, who, restaurant, hotel, flight, definition, define, review, news, weather, time, phone.
Commercial
This includes searches that contain words like: buy, purchase, order, shop, coupon, cheap, cheapest, expensive, pricing.
Location
This includes searches that contain words like: near, nearby, from, directions, how long to, how far away from, how fast, train station, airport, ferry, route, highway, toll, plane tickets, flights, maps, driving directions.
We have also tracked long tail queries (more than one word) separately to see if that affects the CTR.
4.5. Find out if the SERP contains Ads
We matched the entire set of keywords from Google Webmaster Tools with the ones we check for each client in our rank tracker tool, Advanced Web Ranking. This way we were able to get more information about the features included in the SERP, such as whether there were ads, the number of ads and their position, and if any Universal features were included in the search results.
4.6. Create graphs for easier data analysis
We first used Excel to display this data in charts but in the end we ended up creating an in house tool because we realized that it would be interesting to see how the CTR changes over time.
Assumptions and Limitations
These days, with “not provided” being almost 100%, it’s almost impossible to measure how many people reach your website searching for a certain keyword. In this study, we made the assumption that the data collected from GWT with the above methodology is accurate.
The sample data set that was extracted from GWT belongs to our clients. Their businesses, although variate, may belong to certain industries that are different than the industry you are in. Therefore the results may not be the same for every business.
This study measures the CTR that was observed for a special time frame (within the month of July 2014). That means we cannot predict how the CTR changes for keywords that have higher volumes in different periods of the year.
The CTR Study
This is the reference chart for the click-through rate (CTR) of organic desktop searches in Google for July, 2014.
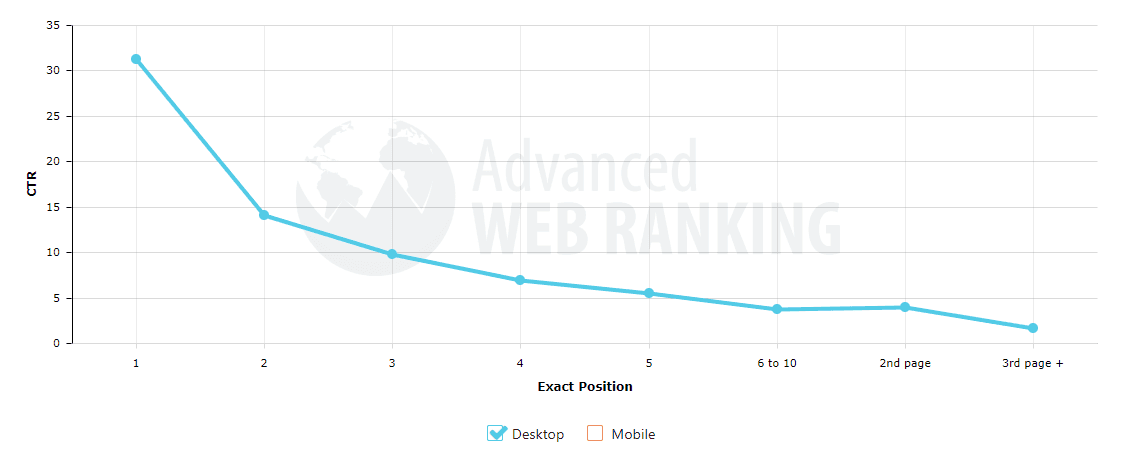
It is important to mention that these numbers reflect the CTR across all the searches included in this study. They do not account for the user intent, the features that appear in the SERP, or whether the keywords used in the search included a brand name. We will address these later in the study when we segment the data.
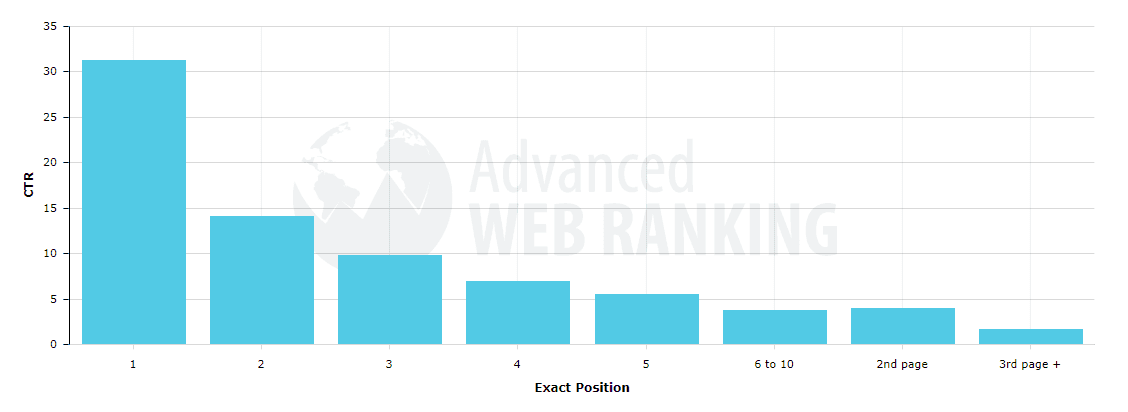
On average, 71.33% of searches result in an organic click on the first page. Page two and three get only 5.59% of the clicks. On the first page alone, the first 5 results account for 67.60% of all the clicks and the results from 6 to 10 account for only 3.73%.
In case you wonder where the other 23.08% of the clicks are, here are some possible scenarios:
Some people may find the Ads displayed above the organic results more relevant.
Some people may not find what they are looking for in the first 10 results so they click on results from the second or third page instead.
Others may not find what they are looking for at all so they refine the search adding more words to the query to be more explicit.
With Google providing more and more instant answers people may very well find the answer to what they are looking for in the displayed search results so there is no need for them to click on any of the results
5.1. Desktop vs. Mobile
Mobile traffic is getting bigger and bigger day by day. Here we can see the CTR for searches coming from mobile devices compared with the searches from desktop devices. Given the fact that you can see fewer ranking results above the fold on mobile, people have assumed that the CTR would be higher for the first results on mobile devices. Let’s see if that is the case:
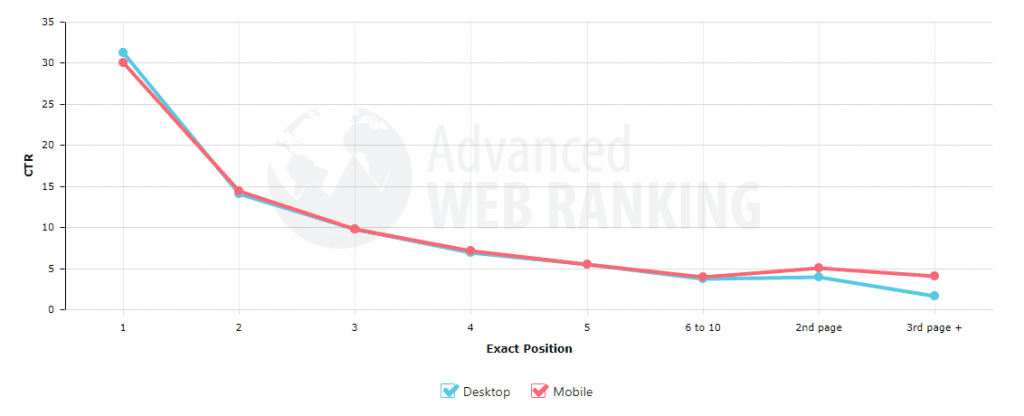
Not only is the CTR slightly lower on the first page, but the CTR for mobile searches actually rises on the 2nd and 3rd page, which is opposite to what we would expect and see from mobile searches.
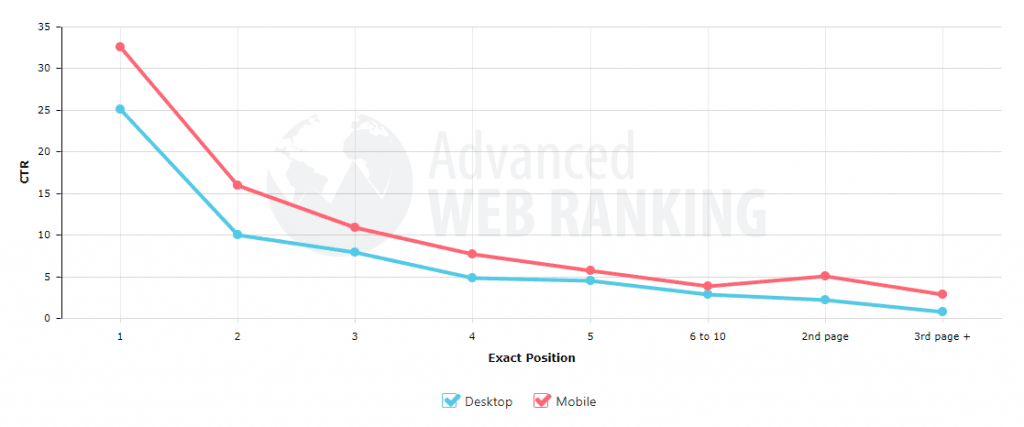
However, if we segment this data to include only searches from US, we can see a big difference between Desktop and Mobile for the results above the fold:
5.2. Ads
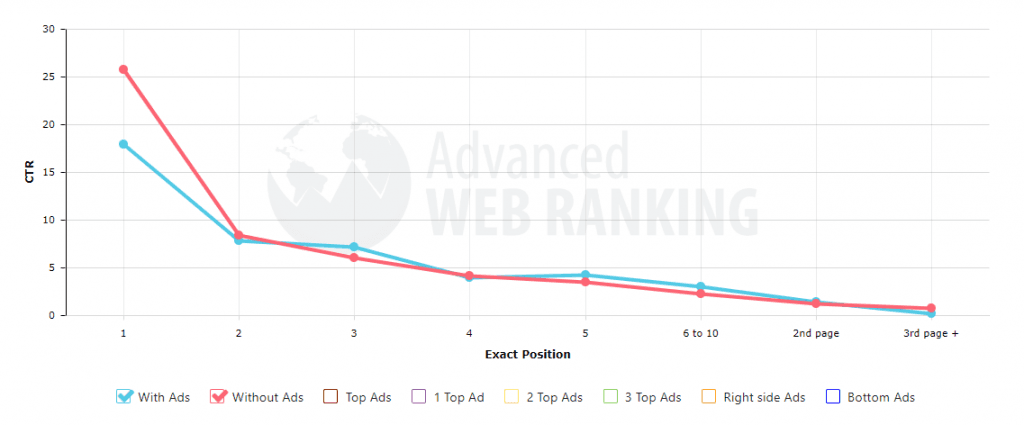
Back when Google started in 1998, there were only 10 blue links in the search results. Nowadays, the organic results are surrounded with ads. Some of them are more visible (the ones at the top and right side) and some of them are less visible (the ones at the bottom of the page).
Some of the ads are made just of text. Some of them show colorful images of products instead. They all affect the CTR on organic results. Let’s see how much.
Location of Ads
How does the location of ads impact CTR? We’ve analyzed the search results that had ads at the top of the page, on the right side and at the bottom of the page.
The pages that have ads at the top (red line) may also have ads on the right side or at the bottom. For those that have ads on the right side (orange line), we made sure there were no ads at the top, but they may have ads at the bottom. The pages with ads at the bottom (blue line) were selected to have no ads at the top or on the right side .
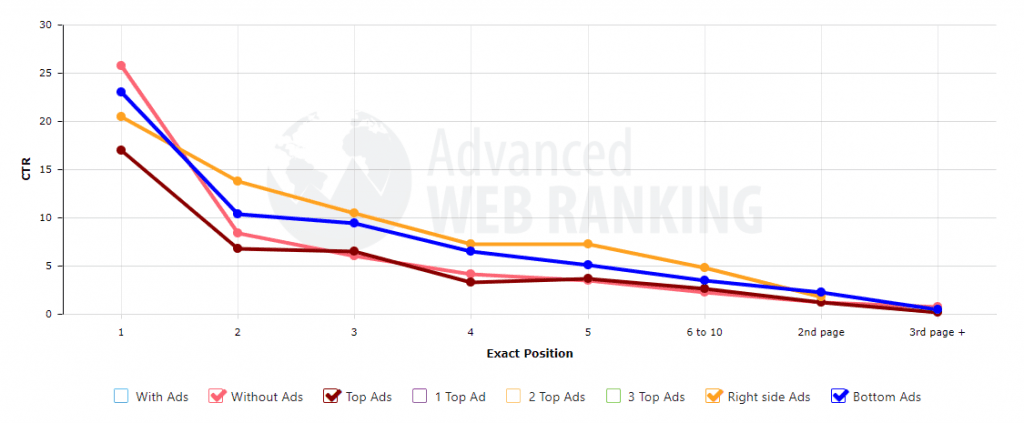
There is no surprise here. Ads in the top positions seem to hurt organic CTR more than ads on the right. But it’s interesting to see that the right side ads and the bottom page ads appear to have a positive influence over the organic CTR.
Number of Ads
We’ve also analyzed the search results that had only one, two or all three ads at the top of the page, to see which one is affecting the CTR more.
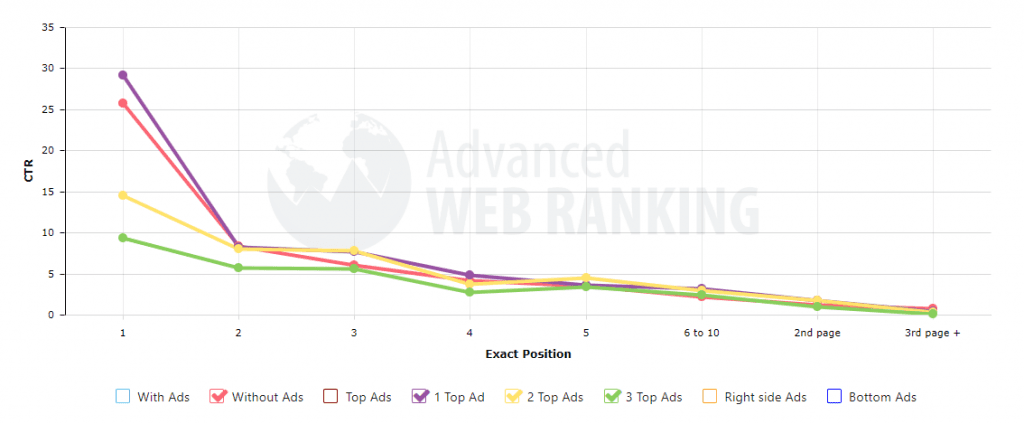
It’s not a surprise for anyone to see searches with multiple ads reduce organic CTR as they drive the organic results further down the page. It’s interesting however to see that searches with just one ad seem to produce a higher CTR for the first organic result than searches with no ads at all.
CTR of Ads
It could be useful to see how the CTR of ads change with respect to their position. Because this study only focuses on organic CTR data, we asked our friends at WordStream to give us some insights into the CTR of paid listings.
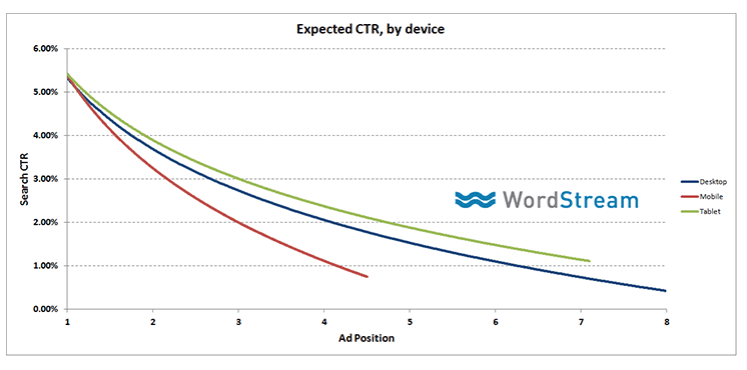
On average, 17.2% of the clicks on desktop searches are attributed to ads, with the top 3 ads accounting for 11.69% of clicks.
It’s interesting that for searches on tablet devices, the ads seem to have a higher CTR than for desktop searches.
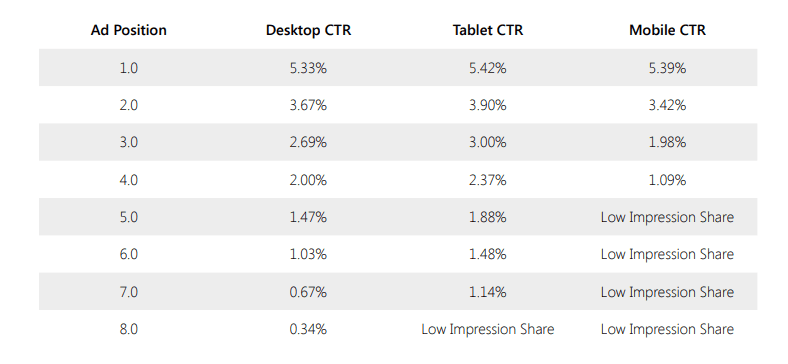
This data is based on an internal study made by WordStream.
5.3. Branded vs. Unbranded
One might assume that when users are making generic searches on Google, they end up making a brand selection from the results retrieved. They choose from the handful of options received, the source of information or provider to trust in for satisfying their need.
But what happens when branded queries are made? If the users are clearly looking for information related to a specific brand, will they follow the same behavioral pattern as for generic searches?
For this study we have defined brand searches as searches that contain the entire domain name of the website in the query, with all the spaces and dashes removed.
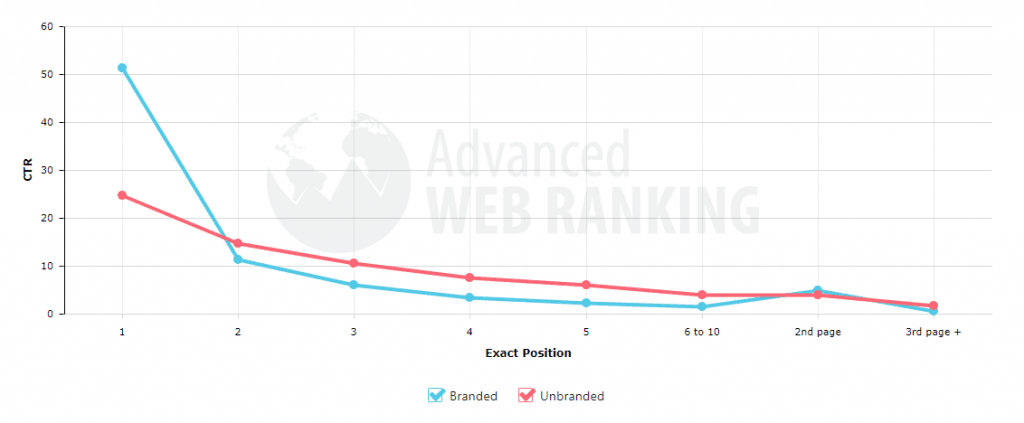
For branded searches the first result is almost always associated with the brand’s website, which makes it the obvious choice for most users and very hard to miss. This would justify the big CTR difference between the first position and the rest of the SERP.
This big difference in CTR may also be affected by the fact that brand searches usually display a pack of 6 site links just below the first result, making it more prominent in the search results.
5.4. Search Intent
Most of us have some sort of intent when we search for something. We may need to find the location of a restaurant or a better price for that big TV we always wanted to get for the living room.
It is believed that people who search for keywords with high commercial intent (“buy 4k LCD TV”) are more likely to click on the first results than people who perform basic informational searches (“where is the nearest thai restaurant”).
Let’s see if search intent does indeed affect how people click on the results.
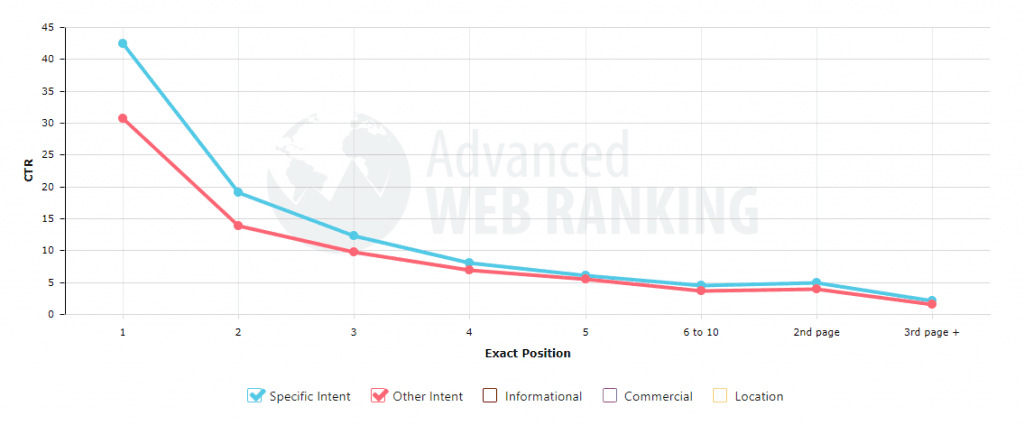
This chart reveals that people tend to click more on the first results when their search has some kind of intent. So we wanted to dig deeper and see which of the search intents affect the CTR and how.
The “Specific Intent” in the chart above is the set of all keywords found in the Informational, Commercial and Location sections and the “Other Intent” means all the other keywords.
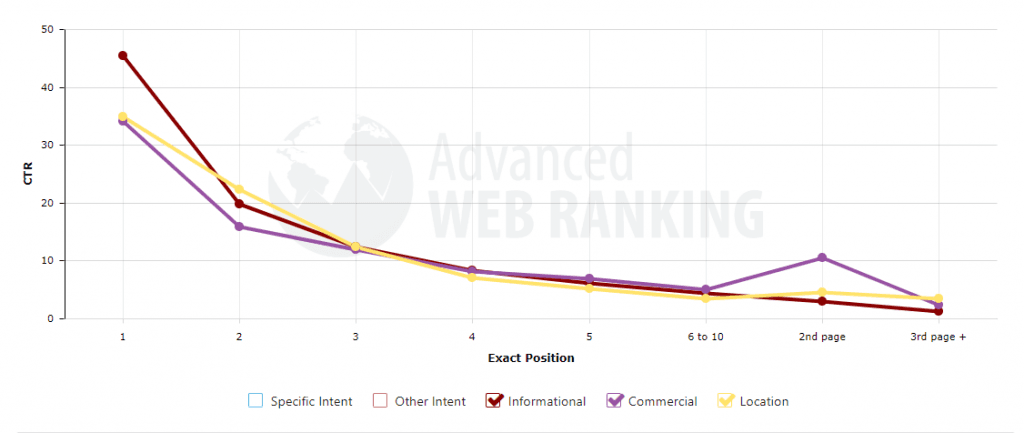
Google is getting better and better at figuring out search intent. Nowadays, many of the search results contain instant answers so people no longer need to click on a website to find out what they’re looking for. The answer is already there.
Commercial intent searches usually trigger ads that have colorful pictures of the products we search. It’s usually a lot more tempting to click on these pictures than on the first organic results.
The following chart compares these three search intents and how they affect the CTR:
5.5. Long tail
Did you know that according to Google search volume data, 33,100 people are searching for “coffee beans” each month? While it would be hard for anyone to guess what they are really interested to find, the intent behind the long tail query “where to buy green coffee beans” is pretty obvious.
Therefore the popular belief that since long tail keywords are more descriptive, people tend to click more on the first results when searching for them. But is it really so?

The collected data shows that the longer the query, the higher the organic CTR is for all SERPs, except for the first position. This might be because of the big CTR we have seen for branded searches in the first position.
Below is the same chart as above but with desktop search data from US only:
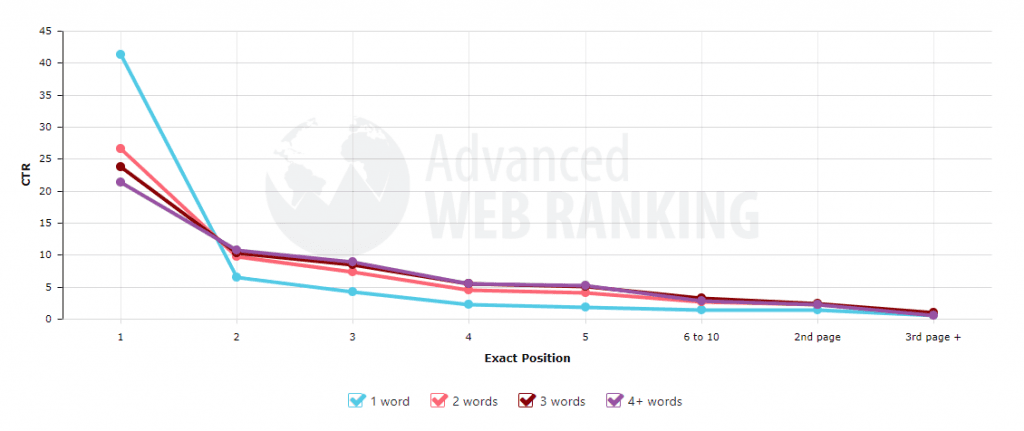
Interestingly, for one word queries in the US, the first position gets the highest CTR, almost double the number of clicks than for the other types of queries. Do most brands in US have their name made of just one word?
Estimating Organic Traffic Based on CTR
Knowing the CTR for each position in the organic search, it would be valuable to see how to use this data to calculate the organic traffic potential of your website.
Depending on the ranking you have for a keyword and how many people click on your website, you can easily calculate how many people would reach your website from organic search.
But things get a little complicated when taking into account that each keyword is different.
As this study showed, searches for branded keywords have a higher CTR. Ads displayed above the organic results determine the CTR to drop significantly for the 1st position.
Search intent also affects organic CTR significantly and long tail keywords searches show higher CTRs for first page listings.
Theoretically, by taking into account all these factors, you could easily estimate the amount of organic traffic you would be driving. The formula is quite simple:

Let’s see an example for an unbranded keyword with a volume of 1,000 searches per month where you rank first in the organic results with no ads above you:

Now, suppose there are ads displayed above the organic results. In this case the CTR drops from 24.8 % to 16.9 %:

Applying this formula for each keyword, enables you to estimate the amount of organic search traffic for any website. However, when using this formula, please keep in mind the differences between the Impressions metric from GWT and keyword search volume.
If your website appears on the third page of search results and the user performing the search does not get past the first page of results, it does not count as an impression for the term searched for. In contrast, a term’s search volume indicates the approximate number of times a term was searched for over a specific time period.
Google CTR History
Each year new CTR studies are conducted and, as seen, the results vary enough from one year to another to justify the startling reactions of online marketers. This lead us into the decision of taking the study one step further this year, and transform the initial CTR study into a free tool.
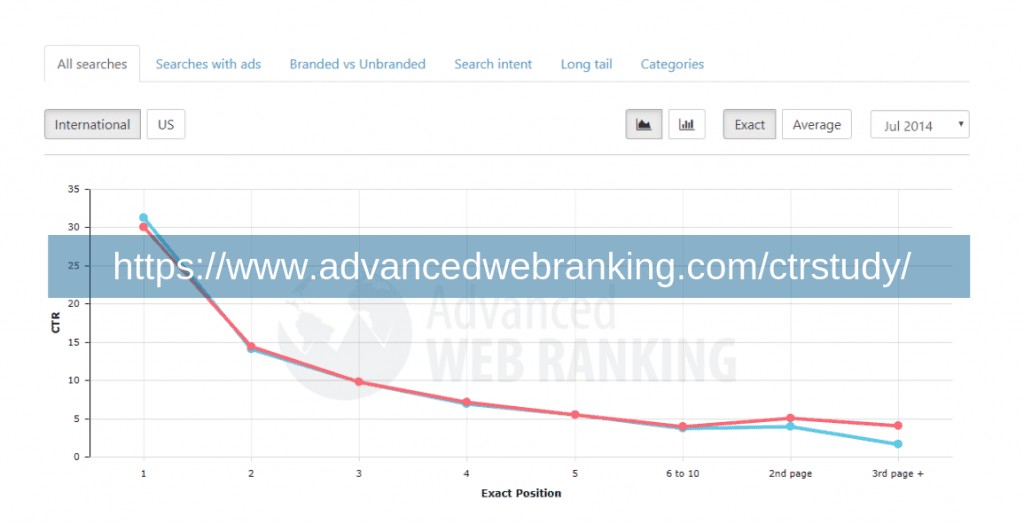
The tool is especially useful for evaluating trends or determining the CTR changes on particular time periods such as the holiday season. It can be accessed for free on our website and allows you to see how organic click-through rates change over time, in relation to all the factors investigated throughout the study.
Glossary of Terms
CTR (Click Through Rate) - The percentage of impressions that resulted in a click for a website. (via Google Webmaster Tools)
Impressions - The number of times pages from a website appeared in search results. (via Google Webmaster Tools)
Clicks - The number of times a user clicked a website’s listing in search results for a particular query. (via Google Webmaster Tools)
Average Position - The average top position of a website on the search results page for that query. To calculate average position, Google takes into account the top ranking URL from the website for a particular query. For example, if Jane’s query returns your site as the #1 and #2 result, and David’s query returns your site in positions #2 and #7, your average top position would be 1.5. (via Google Webmaster Tools)
Exact Position - Exact position shows how often a website appeared in a specific position in search results. For example, if Position 1 has 36 impressions, it means that there were 36 searches for the query in which that particular website was the very first site listed in search results. (via Google Webmaster Tools)
Search Engine Results Page (SERP) - The listing of web pages returned by a search engine after a search query is made.
Organic Results - The listing of web pages in the query results that are not paid advertisements.
Searches With Ads - Search engine result pages that contain paid advertisement listings. Paid results may appear on a SERP at the top, bottom or right side of the page.
Searches Without Ads - Search engine result pages that do not contain any paid advertisement listings.
Searches With Top Ads - Search engine result pages that contain paid advertisement listings, displayed at the top of the page. These pages may also have ads on the right side or at the bottom.
Searches With Right Side Ads - Search engine result pages that contain paid advertisement listings, displayed at the right side. We made sure there were no ads at the top, but they may have ads at the bottom.
Searches With Bottom Ads - Search engine result pages that contain paid advertisement listings, displayed at the bottom of the page. The pages with ads at the bottom were selected to have no ads at the top or on the right side.
Above the Fold - The upper half of a SERP, visible without scrolling down the page. Typically, positions #1-5.
Below the Fold - The lower half of a SERP, visible by scrolling down the page. Typically, positions #6-10.
Branded Searches - A branded search is defined as the query containing a keyword that appears in the domain name.
Informational Intent - An informational intent is identified for queries containing words like: what, when, where, how, restaurant, hotel, flight, news, etc.
Commercial Intent - A commercial intent is identified for queries containing words like: buy, purchase, cheap, pricing, etc.
Location Intent - A location intent is identified for queries containing words like: near, nearby, from, directions, airport, route, maps, etc.
Query Length - The number of words composing the search query: one, two, three or four+ words.
Acknowledgements
We would like to express our thanks to the following people for their contribution to this study:
Danny Sullivan
Danny is a founding Editor of Search Engine Land. He’s a widely cited authority on search engines and search marketing issues who has covered the space since 1996. Danny also serves as chief content officer for Third Door Media, which publishes Search Engine Land and produces the SMX: Search Marketing Expo conference series. He can be found on Twitter as @dannysullivan.
Ian Lurie
Ian is the CEO and founder of Portent. He is the co-author of the Web Marketing All-In-One for Dummies. He writes regularly on the Portent Blog and has been published on AllThingsD, Forbes.com and TechCrunch. He can be found on Twitter as @portentint.
Richard Baxter
Founder and CEO of Builtvisible.com, an agency of people who love SEO, search & creating content that communicates ideas. You can get in touch with Richard on Twitter at @richardbaxter.
Mark Irvine
Mark is Director of Strategic Partnerships at Wordstream. He can be found on Twitter as @MarkIrvine89.
Dan Shure
Dan is the owner of Evolving SEO. He spoke at several industry events such as SMX East in New York where he shares his expertise with on-site technical SEO, WordPress, site architecture and content. He can be found on Twitter as @dan_shure.
Graham Charlton
Graham is the Editor in Chief at SaleCycle. He blogs about eCommerce, mobile commerce, email marketing and more. He can be found on Twitter as @gcharlton.
Tom Anthony
Tom is VP Product at Distilled, where he works on various projects from internal tools to research studies for clients. He is also writing up his thesis for a PhD in Artificial Intelligence. He can be found on Twitter as @TomAnthonySEO.
Alan Ng
Alan is Associate Director of Digital Analytics at Edit Agency where he uses his extensive mathematical knowledge and enthusiasm for search tools, Excel and refining processes. He can be found on Twitter as @_AlanNg.
Article by
Philip Petrescu
Philip is the CEO and Co-Founder of Caphyon, managing the team that is building Advanced Web Ranking since 2003.
stay in the loop


