
In Q2, the average clickthrough rate for websites ranked first on desktop in the Real Estate industry is 28.92%. In contrast, the benchmark CTR for the same position in the Education sector is 45.02%.
Just one quarter earlier, the CTR difference between the two industries for the very same positions was almost three times smaller (5.41 percentage points compared to 16.10 pp). As you can see, these figures frequently shift from quarter to quarter.
Our upcoming Google CTR changes analysis will offer valuable insights into traffic variations you may observe, even if your website's rankings and impressions stay constant.
Branded vs. Unbranded
Significant changes were recorded for the branded queries on mobile searches only. More precisely, for those searches including specific brand or business names, the websites ranked in the first position on mobile experienced a 1.33 pp decline in CTR.
Search intent
When looking at either informational, commercial, or location queries, the CTR values for the websites ranked at the top recorded drops on almost all fronts.
Websites ranked in the first two positions for informational queries (containing words such as what, when, where, how, etc.) recorded a combined 2.30 pp decrease in CTR on mobile (1.26 pp for those ranked first and 1.04 pp for those ranked second). On desktop, the decline affected the websites ranked second only, which witnessed a 1.24 pp drop in clickthrough rate.
A similar trend occurred for commercial searches (containing words such as buy, price, etc.), where the very same websites were affected negatively. More exactly, the websites ranked in the first two positions on mobile recorded a combined 2.35 pp loss in CTR (1.17 pp for those ranked first, and 1.18 pp for those ranked second). On the other hand, the decline affected the websites ranked second on desktop, which registered a 1.71 pp drop in CTR.
As for location queries (containing words such as near, from, nearby, directions, maps, etc.), while the websites ranked in the first two positions on desktop saw a combined 2.93 pp drop, those ranked in the second position on mobile queries experienced a 2.50 pp contraction in CTR.
Keyword length
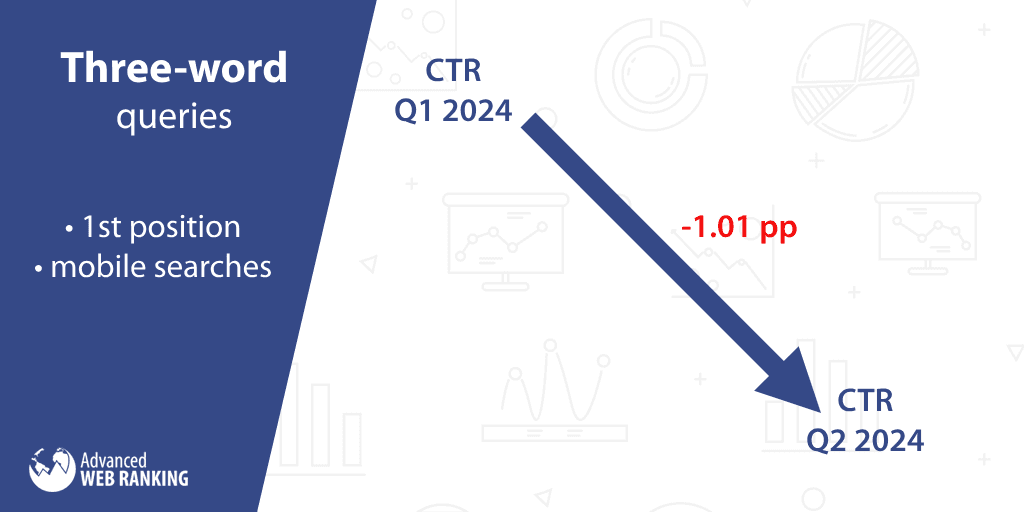
Mobile searches for three-word queries showed notable changes only, wherein the websites ranked first experienced a decrease of 1.01 percentage points in their CTR values.
Industries
In this section, we'll integrate search demand data into our analysis to identify the underlying reasons for potential traffic shifts across different industries, even if rankings remain unchanged.
When a website experiences both an increase in position clickthrough rates and a rise in search demand for its industry, it's likely that traffic will grow. On the other hand, a decline in both CTR and industry search demand may result in a traffic decline.
This chapter will be divided into two parts based on the evolution of search demand.
A. Industries where the search demand increased
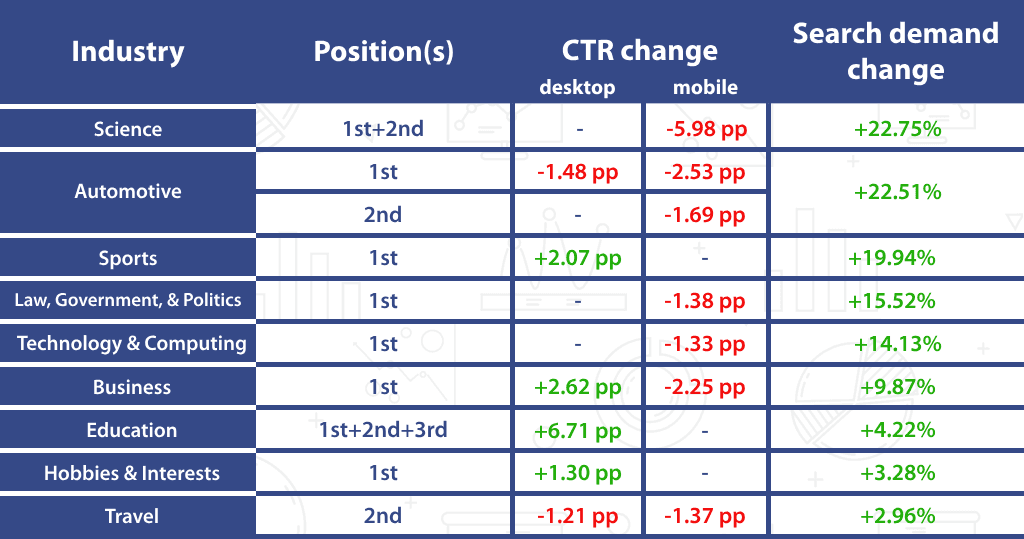
The Science industry continued on a descending trend since the previous quarter when it was proclaimed the market with the highest clickthrough rate decline. In contrast with a +22.75% increase in search demand, the CTR for the websites ranked in the first two positions on mobile experienced a combined 5.98 pp drop in CTR (4.38 pp for those ranked first, and 1.60 pp for those ranked second).
After a quiet quarter (the latest changes date back to Q4 2023) there was some activity at the top of the SERPs this time in the Automotive industry. Therefore, the first two positions on mobile registered a combined 4.22 pp drop, while on desktop the changes affected the websites ranked first only, which witnessed a 1.48 pp decline. At the same time, the impressions for this industry recorded a firm growth of +22.51%.
A similar trend occurred in the Technology & Computing industry, where just like in the Automotive market, after a dormant quarter, the clickthrough rate values experienced changes once again. Here, the websites ranked first recorded a 1.33 pp drop for queries made from mobile devices. In contrast to the decrease in CTR registered this quarter, this industry’s search demand increased by +14.13%.
The websites ranked first in the Sports industry experienced a 2.07 pp increase in CTR on desktop. Coupled with a growth of +19.94% in search demand, it’s highly probable that these websites noticed a spike in organic traffic.
Being an election year, it was expected that the volume of searches would increase in the Law, Government, & Politics market. Here, our search-demand tool recorded a +15.52% growth, while the CTR for the websites ranked first on queries made from mobile devices declined, on average, by 1.38 pp.
Desktop and mobile CTR values went in opposite directions this time around in the Business category, for the websites ranked first as follows: on desktop, the growth in clickthrough rate was 2.62 pp, while on mobile, the drop equaled 2.25 pp. Concurrently, the number of impressions for this industry increased by +9.87%.
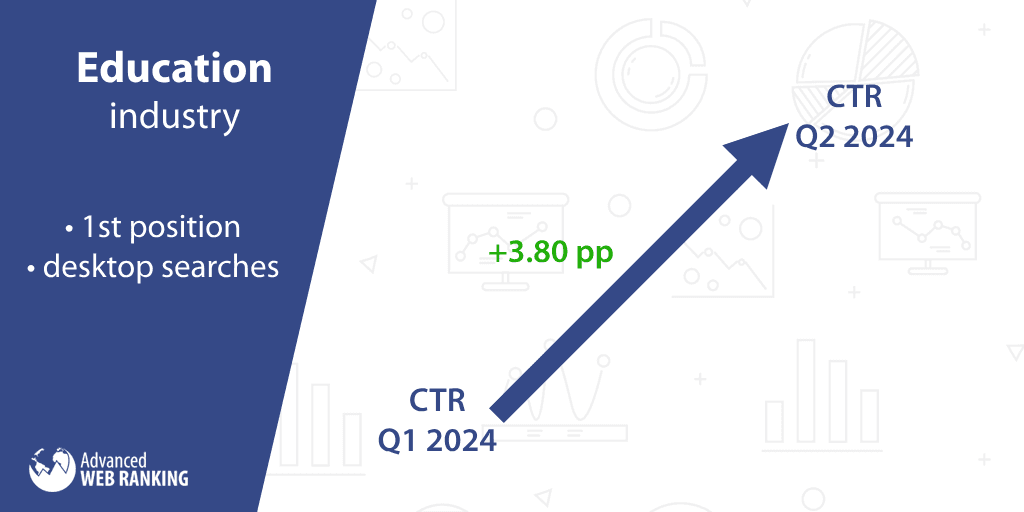
It’s time to turn our attention to the highest growth in CTR for a single position: the Education market. Here, the clickthrough rate for websites ranked first on queries made from desktop devices grew, on average, by a remarkable 3.80 pp.
On the other hand, still on desktop queries, those ranked second experienced a 1.82 pp boost, while those in the third spot registered a 1.09 pp growth. And gladly, people’s interest in education grew, being translated into a +4.22% increase in impressions.
As for the Travel industry, surprisingly, the websites ranked first weren’t quite influenced by the changes. However, those ranked in the second position registered a 1.21 pp drop in CTR on desktop and a 1.37 pp decline on mobile. Here, the search demand increased by +2.96%.
One last market where the search demand grew (by +3.28%) is Hobbies & Interests. At the same time, the CTR values went in the same direction, at least for the websites ranked first on desktop, which registered a 1.30 pp boost.
Here’s a visual recap of the changes mentioned above:
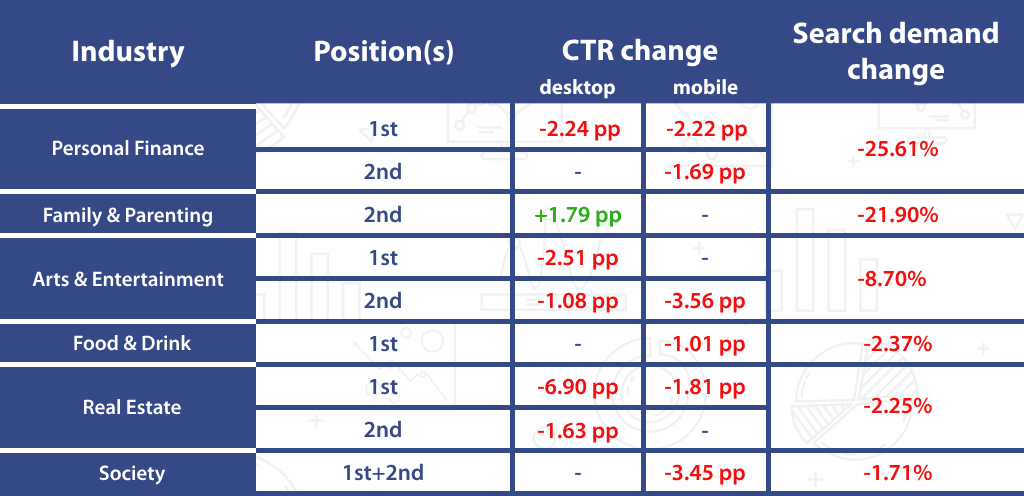
B. Industries that experienced a drop in search demand
The websites ranked in the first two positions in the Personal Finance market experienced a combined 3.91 pp loss in CTR on mobile (2.22 pp for those ranked first, and 1.69 pp for those ranked second). As for the desktop queries, the changes affected the websites ranked first only, which witnessed a 2.24 pp drop in CTR.
At the same time, the industry’s search demand dropped in this second quarter of the year compared to Q1 (-25.61%).
It’s been a year already since the Family & Parenting market last recorded fluctuations in clickthrough rate and it was about time for it to make it into this quarter’s report. Here, the websites ranked second on desktop registered a 1.79 pp increase in clickthrough rate, while the industry’s overall impressions dropped by -21.90%.
As for the Arts & Entertainment industry, the clickthrough rates for the top two websites registered a combined drop of 3.59 pp on desktop, while on mobile, only the websites ranked in the second position were influenced by the changes, recording a 3.56 pp decline. These changes in CTR coupled with a decrease of -8.70% in this industry’s overall search demand might translate into a loss in traffic for those websites affected by the changes.
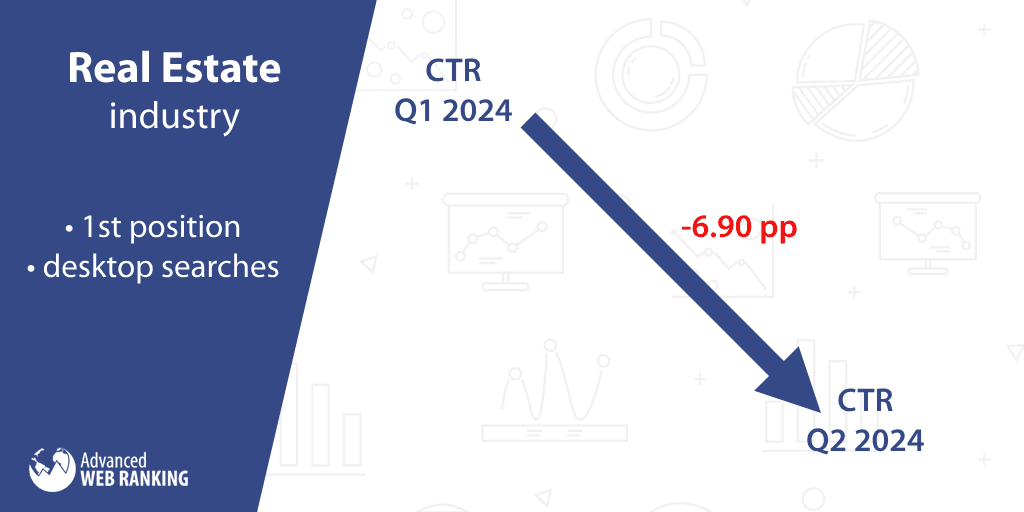
And now let’s jump to the industry with the highest decrease in clickthrough rate for a single position: Real Estate. Here, the CTR for the websites ranked first on queries made from desktop devices dropped, on average, by 6.90 pp.
On the other hand, the decline affected the websites ranked in the second position on desktop, as well, which recorded a 1.63 pp drop in CTR, while on mobile, the websites ranked first witnessed a 1.81 pp decline.
Simultaneously, this market’s overall search demand decreased slightly by -2.25%.
Last but not least, let’s have a look at the Society category, which recorded a decrease in CTR on mobile devices only. For these queries, the websites ranked in the first two positions experienced a combined 3.45 pp loss in CTR (2.29 pp for those ranked first, and 1.16 pp for those ranked second) while this industry’s overall search demand decreased by -1.71%.
Here’s a visual round-up of the CTR evolution in all six industries mentioned above:
That’s it for…the second quarter
The second quarter of 2024 brought significant fluctuations in clickthrough rates across various industries. There were also changes affecting the informational, commercial, and location-based queries, as well as the branded searches, and the mobile queries containing three words.
Our next report on CTR fluctuations will be even more intriguing, as it may reveal the impact of Google's decision to end continuous scrolling. It will be fascinating to see if these changes further lead users to explore those top results and how the clickthrough rates of those websites ranked outside the top 10 will evolve.
The results will be revealed by the end of the year, so make sure to subscribe now and be the first to access our upcoming study's findings.
Until then, stay safe and healthy!

Article by
Dan Popa
Dan Popa is an Online Marketing Strategist at Caphyon. He is passionate about both Online and Offline Marketing and he's always looking for new ways of applying the basic principles of marketing in the fast-evolving SEO field. He's always in the mood to chat about new creative ideas for campaigns, so you can find him on Twitter.


stay in the loop