
See Ya, Sampling! How to Get More Complete GSC Data With BigQuery & Keep Costs Low
If Google Search Console’s historical data limits went away tomorrow, SEOs would be in the streets throwing alligator parties. (Too soon?)
Fortunately, we don’t have to wait for tomorrow. With BigQuery, you can free your data from GSC-imposed limits — even the annoying sampling that results in a significant amount of clicks left unaccounted for.
*Pauses for dramatic gasp.
So why isn’t everyone scrambling to set up BigQuery? It’s because potential users:
Aren’t clear on the benefits or how to get started.
Feel overwhelmed by the Google Cloud Console.
Have anxieties about racking up big bills.
Luckily, a simple blueprint is all it takes to overcome these obstacles and take control of your data. I’ll share an approachable guide to exporting GSC data to BigQuery while building safeguards that keep costs low.
Is BigQuery worth it?
To understand why BigQuery has potentially massive benefits for GSC data and beyond, let’s dissect what it is. In Google’s own words:
Translation:
BigQuery is a single place to store, manage, and analyze data from different sources.
It gives you a ton of flexibility in terms of retrieving and filtering data. (You’ll do this using SQL queries.)
The cloud-based architecture is fast, scales without issues, and doesn’t require internal resources to manage.
What are the benefits of exporting GSC data to BigQuery?
1. More data accuracy
Traditionally, SEOs run into the following issues with sampling in GSC:
Data is unavailable for many low-volume/longtail queries for “privacy” reasons.
Several clicks that appear in aggregate totals are unaccounted for once you filter data — especially amongst non-brand queries.
The daily data row limit only returns GSC in-platform results up to 1,000 rows, which poses an issue for larger sites.

While BigQuery doesn’t eliminate anonymized queries, it greatly reduces them, making it a huge draw if accurate keyword research is a priority. Even when comparing the GSC API to Bulk Export (GSC to BigQuery), it’s clear that the latter results in greater data accuracy and richer context.
The daily row limit makes it pretty obvious why larger sites might want to export their GSC data to BigQuery, but smaller sites also benefit from less anonymization.
Think about brands with more niche offerings, who generally compete in low-volume keyword landscapes. When there aren’t many clicks to compete for, understanding as much as you can about every click coming in is invaluable!
2. More historical data
Most SEOs are intimately familiar with the rolling 16-month window of data in GSC. It’s just enough to compare the current quarter YoY, but not enough to conduct any sort of meaningful long-term analysis beyond that.
When you start exporting and storing your GSC data in a BigQuery implementation, the window of data starts to grow. You’re pulling the data that would eventually go away in GSC and storing it where you can access it at any time.
To be clear, that doesn’t mean you’ll have all of the data back to the dawn of your domain. It means you’ll have 16+ months starting the day you implement BigQuery. (Another great reason not to put BigQuery on the backburner — you’re losing data!)
Connecting GSC to BigQuery with Bulk Export
To unlock the benefits we just talked about, you’ll need to enable Bulk Data Export from GSC to BigQuery. This allows sites to export all of their GSC performance data to storage on an automated schedule.
Google has helpful documentation to guide you, which I’ve linked for each step:
Create a Google cloud billing account - if your organization doesn’t already have one.
Create a project and enable the BigQuery APIs - specifically, the BigQuery API, BigQuery Storage API, and BigQuery Data Transfer API.
Enable bulk export - Give Search Console permission to dump data to your project, then enable Bulk Data Export in Search Console.
Once Bulk Data Export is good to go, data shows up within 48 hours of successful configuration.
Making sense of data in BigQuery
ALL of your performance data is exported. What does that mean in terms of what’s available, and how do you navigate it in BigQuery?
The data isn’t categorized, summed, or otherwise grouped in any way. Instead, each instance of an impression or a click to a URL is logged as an individual row, the columns of which include all of the following fields from the Google Search Console table schema.
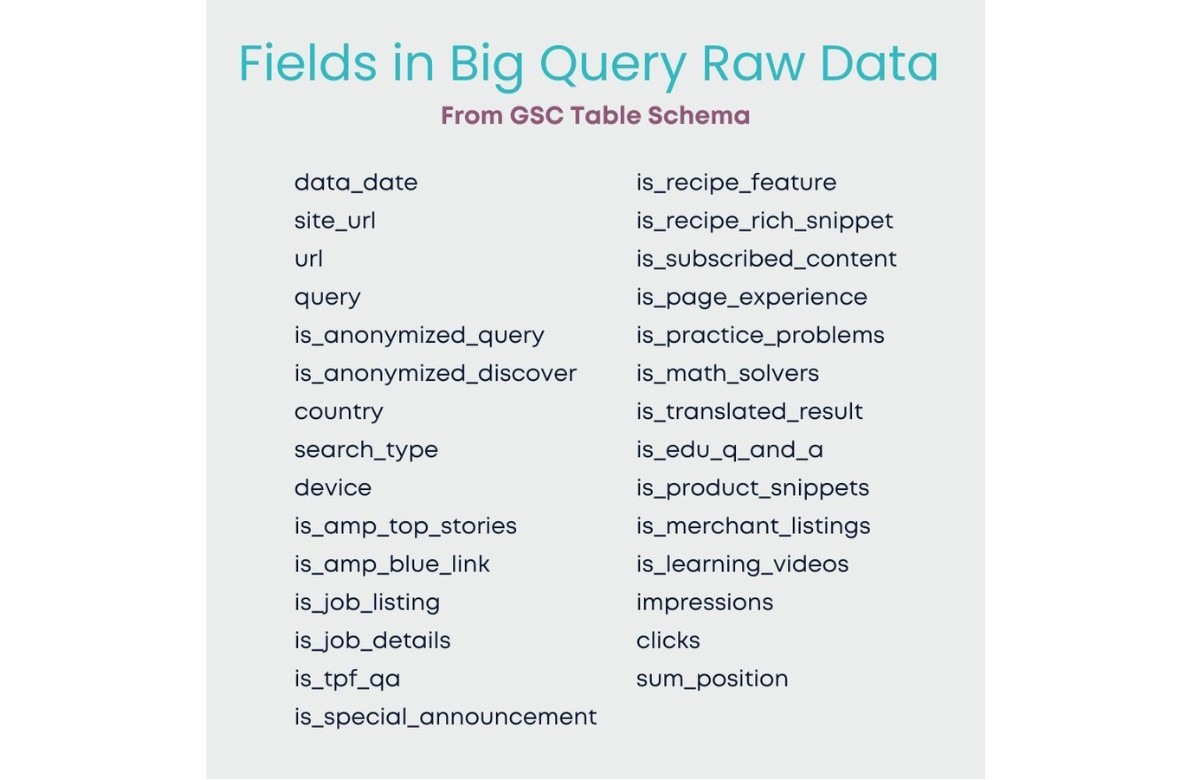
The list gives you a sense of just how many fields there are. Too many to define in this article — and a bunch you probably don’t need! (You can learn more about the tables and fields in Google’s table guidelines and reference.)
Things start to get a little bit messy when all of those fields are in the raw data table.
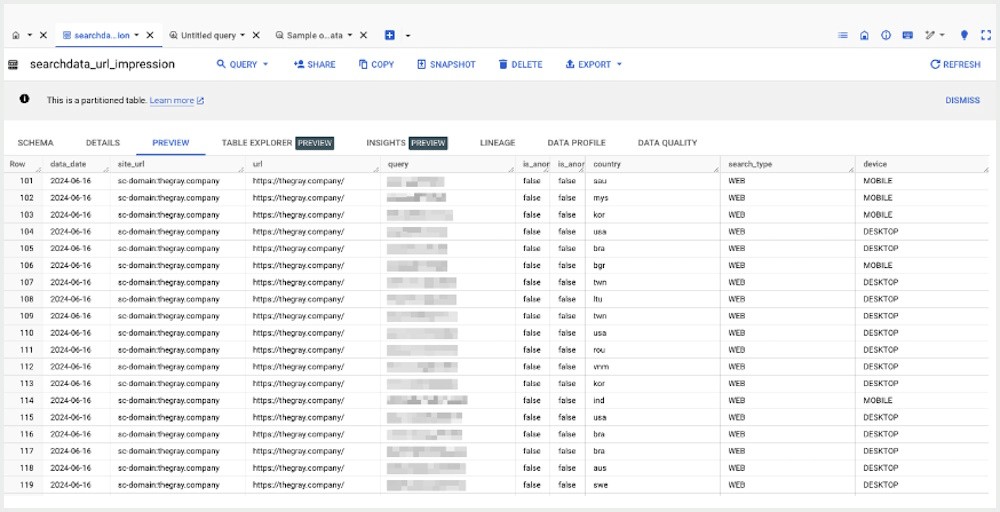
It’s very much just a stream of “stuff.” This data isn’t useful for analysis until we can group the rows based on qualifiers like URL, query, location, device, etc.
Plus, the data isn’t helpful to the larger team if they can’t access, view, and manipulate it outside of BigQuery. Usually, that means piping BQ data to a dashboard or report built into a tool such as Looker Studio.
Retrieving data using SQL queries
Retrieving, grouping, and aggregating data in BigQuery - and pulling that data into a tool like Looker Studio or Gooddata - is accomplished by running a SQL query.
The thought of writing SQL queries might seem a little daunting. But as long as you know which data you need and the table it's in, AI tools can generate the query for you.
With that being said, it’s important to have a baseline knowledge of how a query works to successfully use the tools. The most commonly used query is the SELECT function, which retrieves data based on the fields, conditions, and information available.
An easy way to think about using this type of query to retrieve GSC data is that you’re doing the same thing as when you apply filters to see results in the GSC UI. Stuff like:
Show me all queries that contain my brand name.
Filter impressions to the last 3 months, month-over-month, and only for the /blog/ folder.
With queries, you put in a bit more work on the front end, but you also have more flexibility.
Building a Query
Let’s break down the basic structure of a SELECT query and how each of the components operate.
The first two fields (SELECT, FROM) are required, and the last two fields (WHERE, ORDER BY) are optional. Here’s how they would come together in a simple SELECT query for the past three days of site clicks and impressions from search queries in the United States.
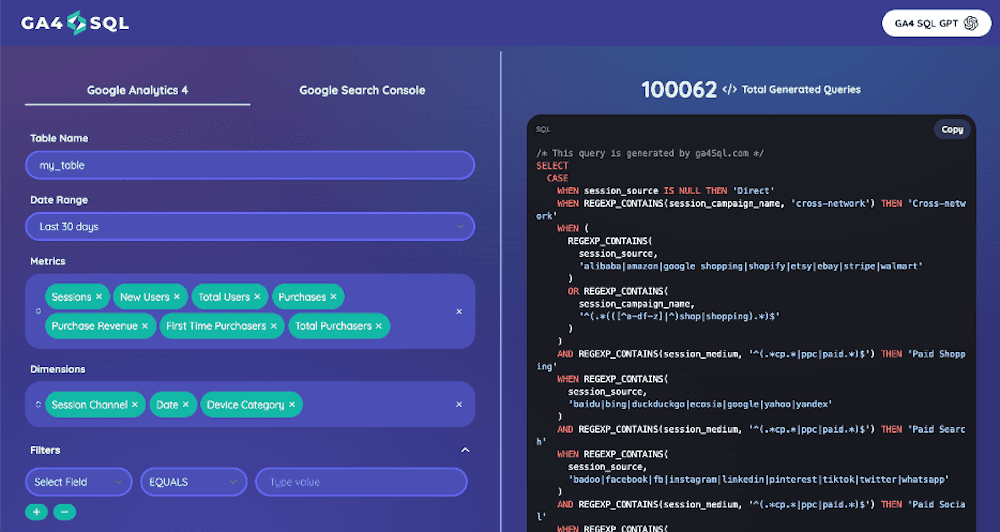
SQL query can get increasingly complex, like the example below, depending on what you’re trying to retrieve.
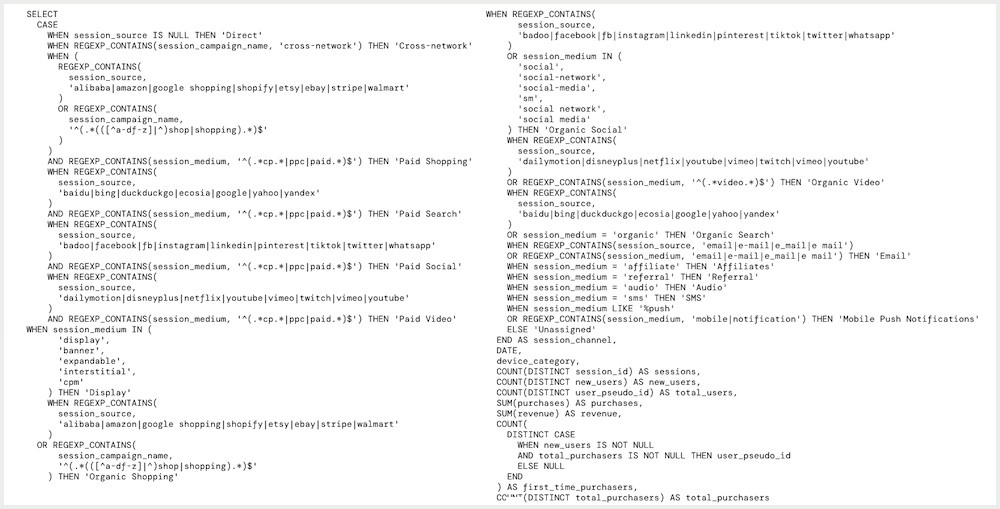
Whether simple, more layered, or head-scratchingly complex, tools like GA4SQL make it easy.
Keeping BigQuery costs down
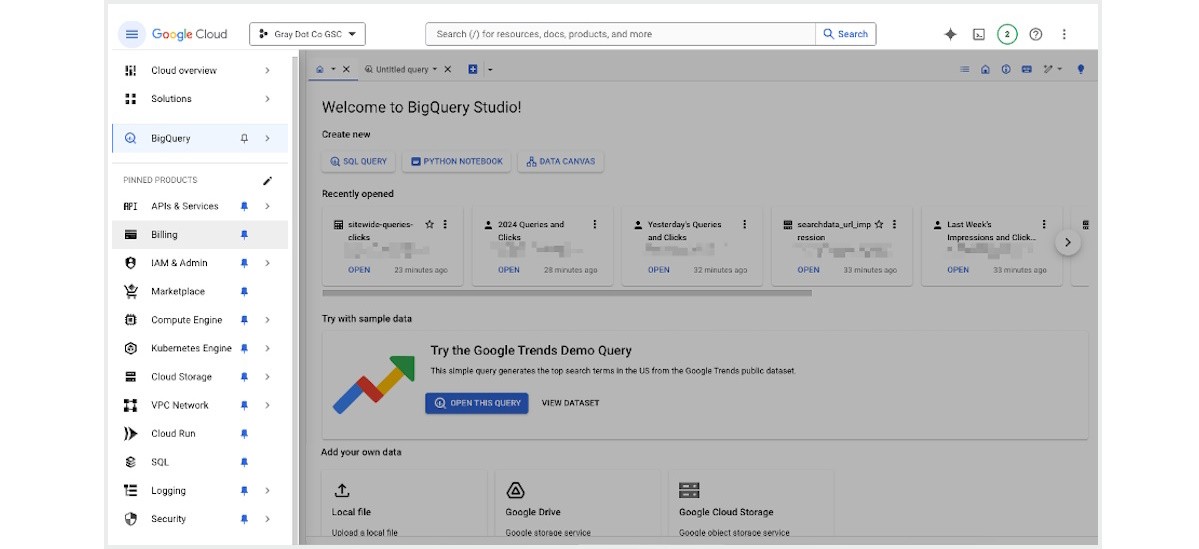
Once a query is built, it's ready to run in Explorer, where data will populate.
BigQuery estimates the cost of any query you enter into Explorer in terms of bytes processed before you run it.
That’s an important insight because processing costs are a big piece of the puzzle when it comes to staying within budget.
To keep costs in check, it’s helpful to understand the two different types of BigQuery pricing:
Compute pricing is the cost to process queries (first 2 TiB free/month).
Storage pricing is the cost to store data that you load into BigQuery (first 10 GiB free/month).
Outside of very large publishers with an abundance of data, storage costs are pretty low. The first 10 gibibytes (GiB) are free each month, which is quite a bit of data. For example, a full day’s export for our Gray Dot Co site normally results in a file size of ~0.004 GiB.
On the other hand, compute pricing can rack up quickly — especially if Looker Studio is querying the raw data and computing metrics each time it's loaded. (i.e. Every time you refresh the report, or add another filter.)
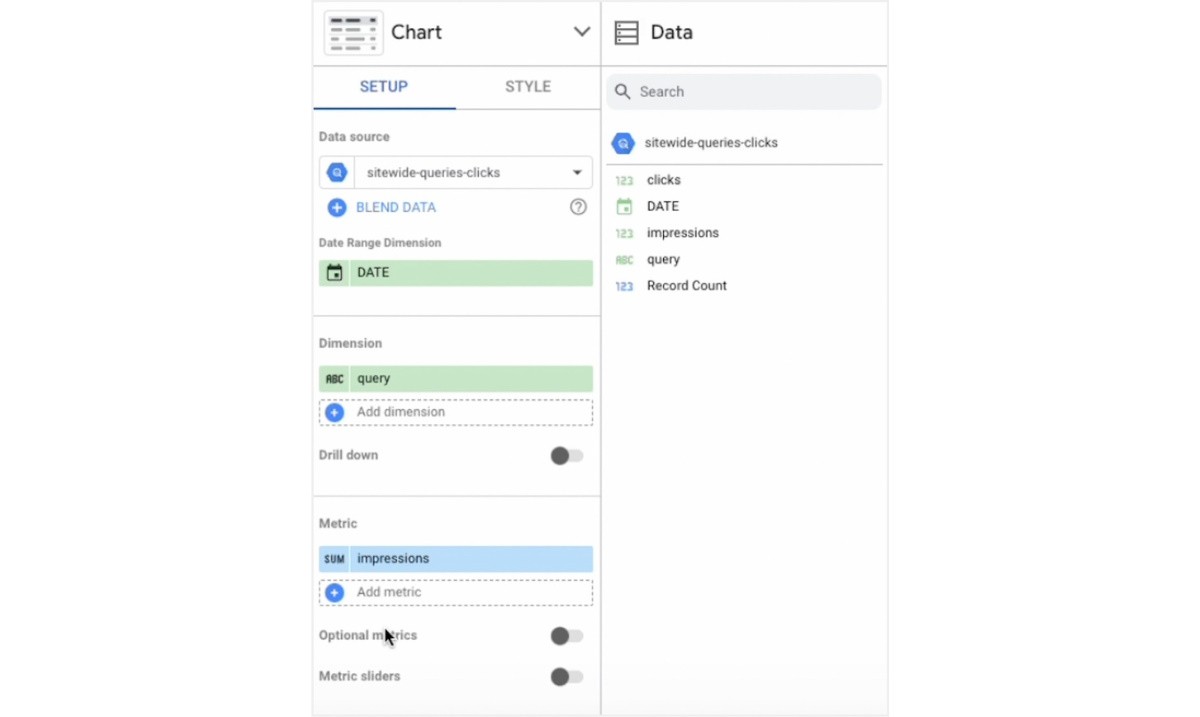
Take the chart in the top-left of the Looker Studio report below. It’s filtering for queries that contain specific words, summing impressions, and grouping them by month.
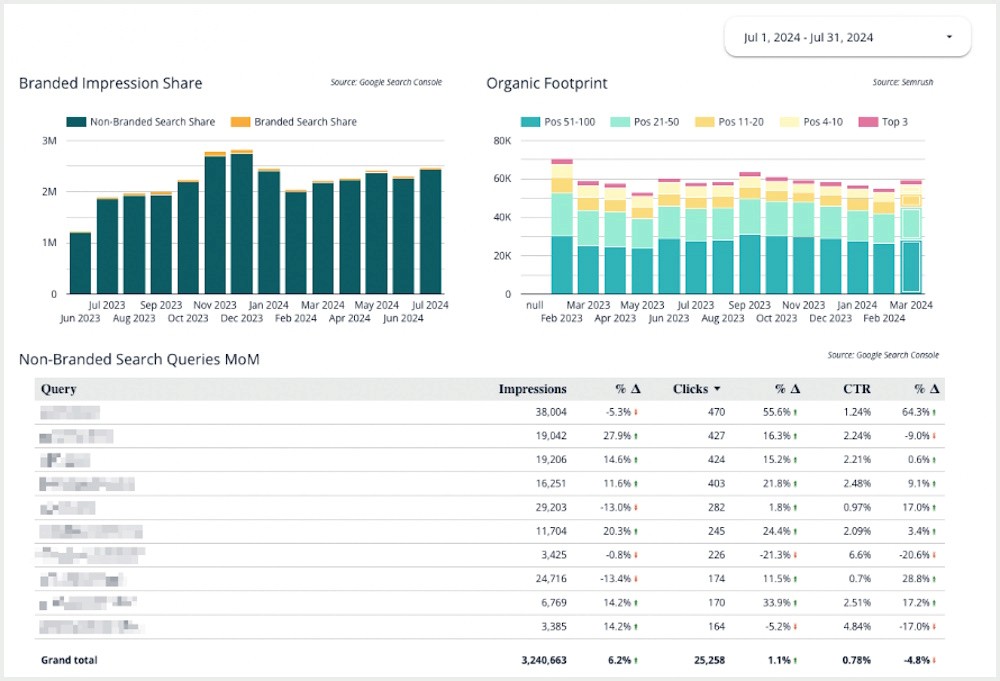
In the default configuration for BigQuery, this seemingly harmless table could rack up additional compute costs every time someone on the team opens the Looker Studio report.
Luckily, there’s a way around this.
Leveraging permanent tables
Enter permanent tables (which I like to call “aggregate” tables).
When you run a query in Explorer, the data caches in a temporary table by default. With permanent tables, you can run queries once a day and store any results and calculations as a file to reference.
That means that when you’re in Looker Studio, it’s referencing stored data versus putting processing power toward running queries on-demand. That’s a huge difference! (Before you can store queries in a permanent table, ensure that you’ve successfully configured any additional permissions required.)
How to create a permanent table
Instead of trying to build a complete table from the get-go, you can start with a few queries based on what’s most useful to your business (URL, query, device type, country, etc.). The nice thing is that you can refine and add to your permanent tables over time and still get results retroactively because you own the data.
To create a permanent table from any query, enter it in explorer and hit the “More” button. Then go to “Query Settings.”
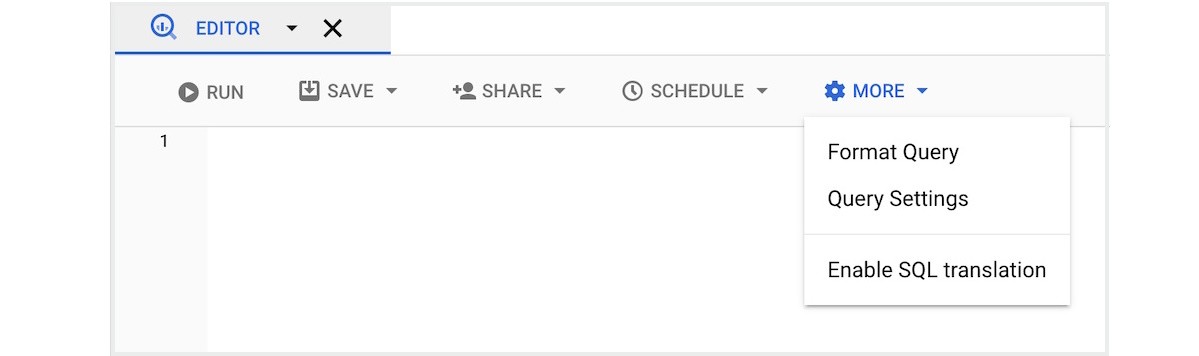
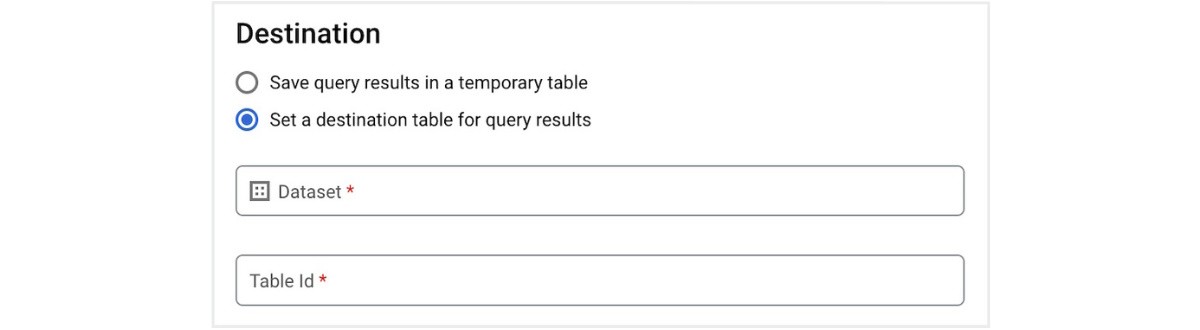
From there, you can select the destination table for data storage. You can also tell BigQuery whether it should overwrite what’s in the table, add to it, or only add the new data if the table is empty.
Make it a scheduled query
Once you’ve run your query in Explorer and are satisfied with the results, you’re ready to create a scheduled query, which makes it run on an automated schedule. Click “Schedule” and open the “New Scheduled Query” pane.
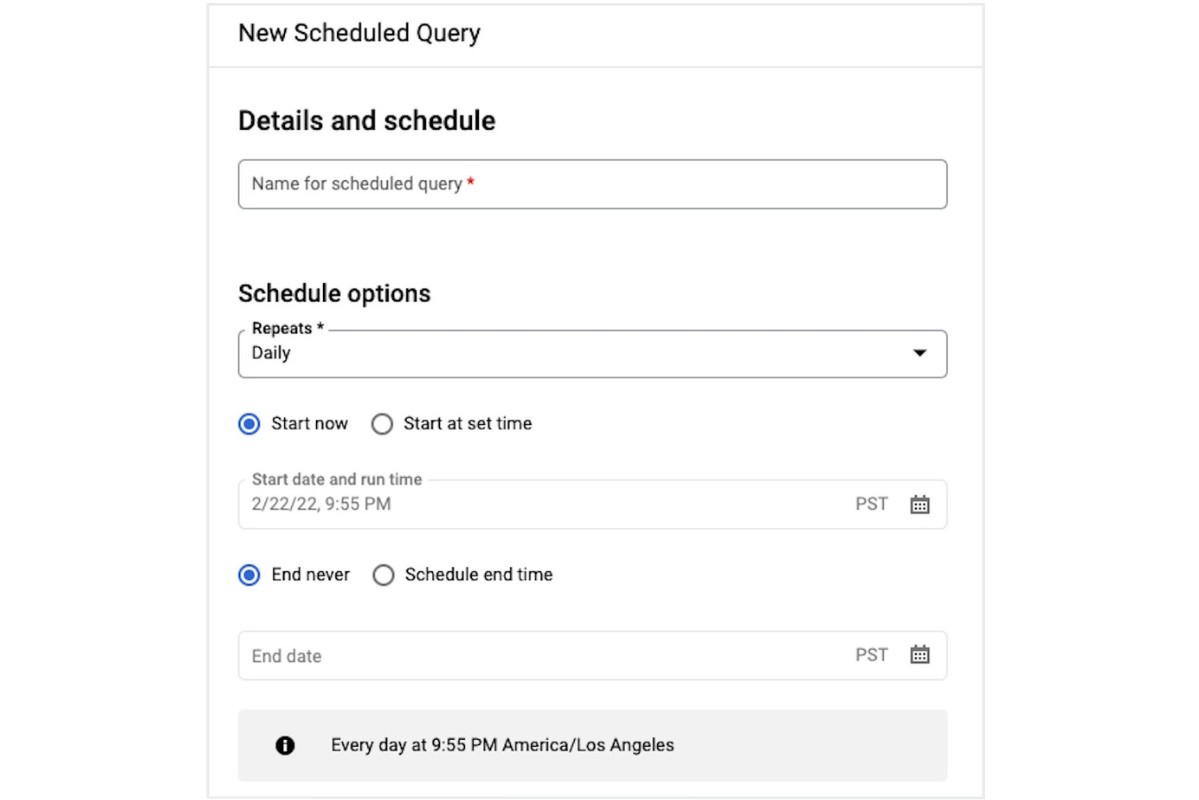
Choose the appropriate destination data set and enter the table ID for your permanent table. For any scheduled queries, you’ll select “Append to table”.
Other ways to optimize processing costs
Now you have a permanent table you can reference in your Looker Studio reports, so you’re not racking up processing costs as you analyze data and build/reference dashboards.
While it’s not the only way to keep costs down, it accounts for the most common mistake we see in setups generating unexpected bills. It also makes your Looker Studio reports run a lot faster.
Additionally, you can check out some of Google’s cost optimization best practices for processing in BigQuery.
Setting a Google Cloud budget
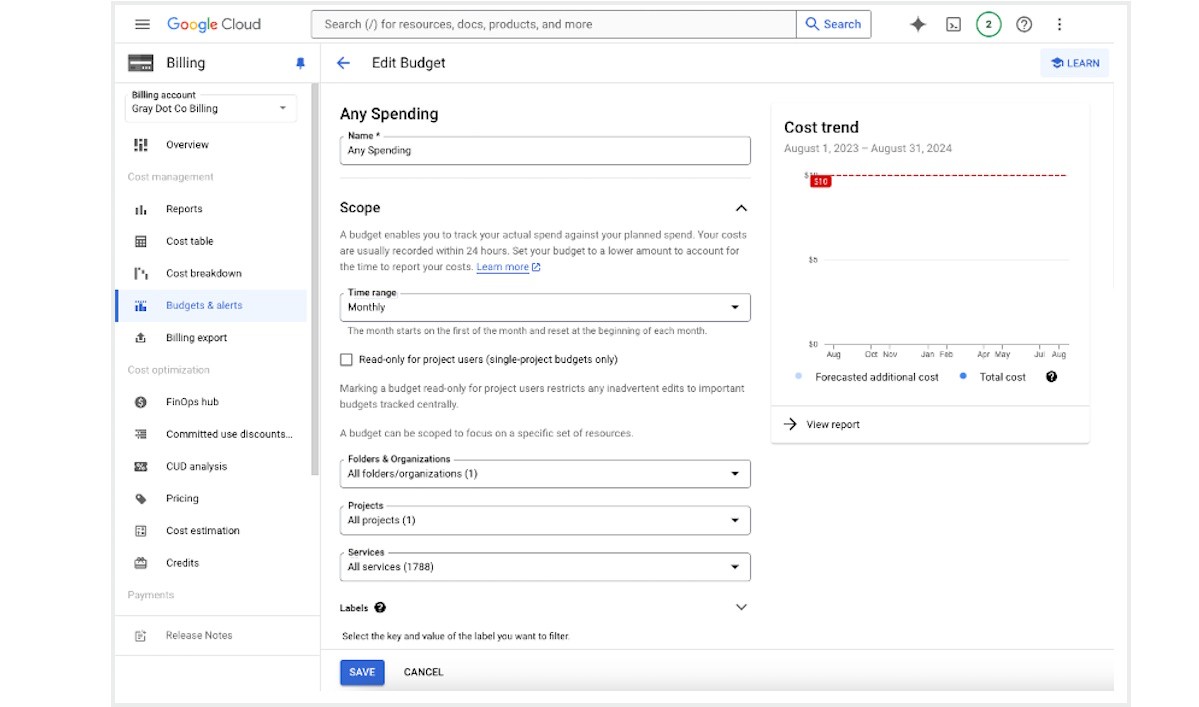
Even with best practices for cost optimization in place, your true failsafe against out-of-control costs are setting a Google Cloud budget.
The budget will default to your entire Google Cloud account, but you can allocate a budget specific to one or more projects. You’ll also need to identify the budget timeframe.
Creating a single-project budget has some additional nuances to the steps below, which you can read about in Google’s documentation for creating a budget.
You can enter an amount or choose the “use last month’s spend” option.
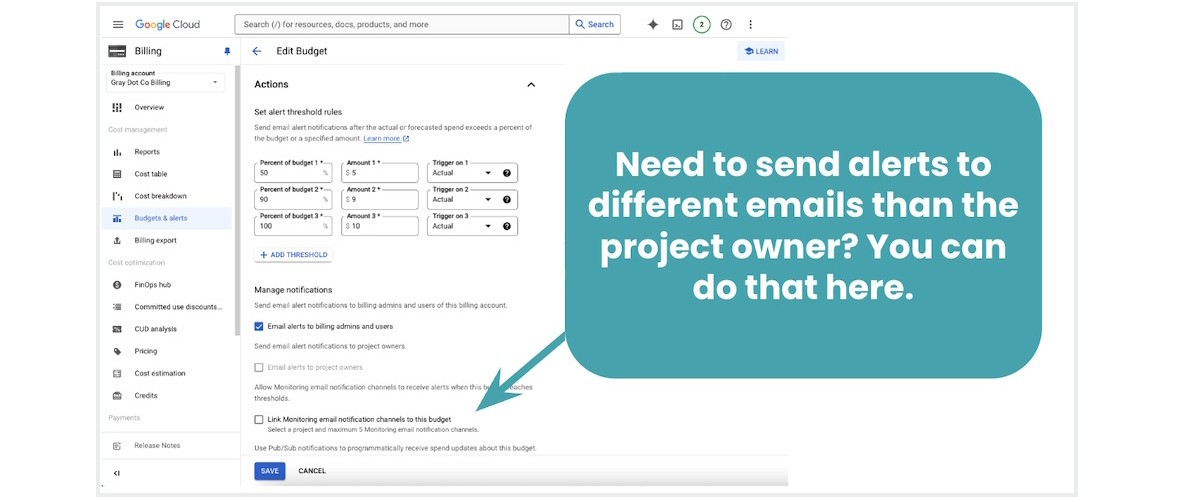
Once spend nears the percent threshold you set, Google Cloud will send a notification to budget admins and any members of a custom notification group (up to five non-admin email addresses).
Analyzing BigQuery Data in Looker Studio
Now you’re all set to pipe data from permanent tables to reports and dashboards in Looker Studio. This is how you’ll make the information easily accessible to relevant stakeholders, including yourself.
After all, Big Query is great for pulling data — but not as great for visualizing it in a friendly UI. Whereas, Looker Studio offers a number of different options for visualizing data in more digestible ways.
Adding permanent tables as Looker Studio data sources
Start by connecting to BigQuery on the “add data to report” screen.
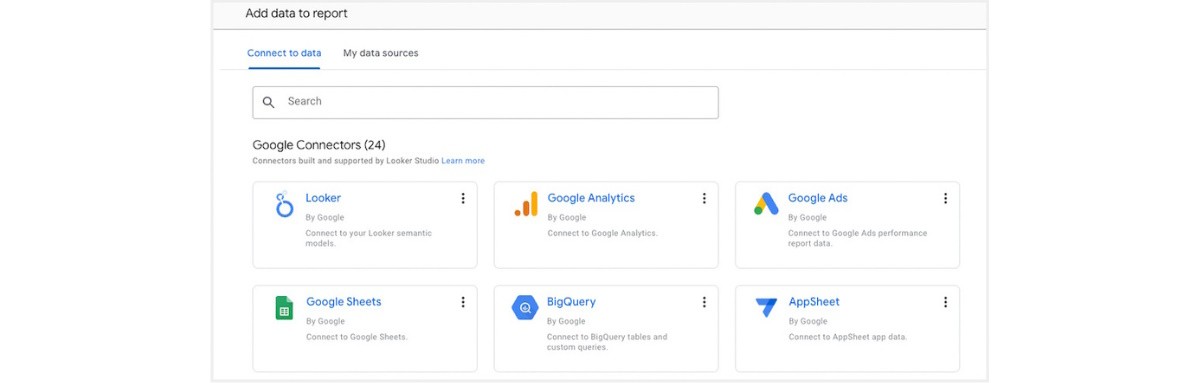
Then, select your permanent table(s) from the correct project and dataset.

As you build tables and charts in Looker Studio, the permanent table will show up as an available data source. Any dimensions used to group data in your permanent table, as well as any metrics calculated there, are available to pull into the report.
If you aren’t familiar with how to use Looker Studio, Google’s documentation is a great place to find tutorials, templates, and more.
BigQuery implemented, big things ahead
Congrats! You’ve freed yourself from GSC data limits — not to mention gaining big ground against one of the most classic SEO data conundrums (GSC sampling). And it’s just the tip of the iceberg…
As you refine your permanent tables and begin to blend GSC data with other sources, you’ll tap into a whole new world of functionality, flexibility, and scalability.
Luckily, you’re now well-equipped to explore the possibilities without raising costs.

Article by
Sam Torres
Sam Torres is far from your average tech SEO… or developer… or data architect. Her varied and deep skill set lets her blur the lines between disciplines and see new ways of solving problems. She applies that unique perspective as Chief Digital Officer of Gray Dot Co, building solutions that push search marketing forward and help brands measure outcomes more meaningfully. Humble, humorous, and refreshingly honest, she also brings the heat as a speaker!


stay in the loop